![[DBPP]](pictures/asm_color_tiny.gif)


![[Search]](pictures/search_motif.gif)
Next: 9.5 Summary
Up: 9 Performance Tools
Previous: 9.3 Data Transformation and Visualization
Next, we describe a number of both public-domain and commercial
performance tools, explaining how each is used to collect and display
performance data. While the tools exhibit important differences,
there are also many similarities, and frequently our choice of tool
will be driven more by availability than by the features provided.
Paragraph is a portable trace analysis and visualization package
developed at Oak Ridge National Laboratory for message-passing
programs. It was originally developed to analyze traces generated by
a message-passing library called the Portable Instrumented
Communication Library (PICL) but can in principle be used to examine
any trace that complies to its format. Like many message-passing
systems, PICL can be instructed to generate execution traces
automatically, without programmer intervention.
Paragraph is an interactive tool. Having specified a trace file, the
user instructs Paragraph to construct various displays concerning processor
utilization, communication, and the like. The trace files consumed by
Paragraph include, by default, time-stamped events for every
communication operation performed by a parallel program. Paragraph
performs on-the-fly data reduction to generate the required images.
Users also can record events that log the start and end of
user-defined ``tasks.''
Paragraph's processor utilization
displays allow the user
to distinguish time spent computing, communicating, and idling.
Communication time represents time spent in system communication
routines, while idle time represents time spent waiting for messages.
These displays can be used to identify load imbalances and code
components that suffer from excessive communication and idle time
costs. Some of these displays are shown in
Plate 8,
which shows a Gantt chart (top part) and a space time diagram (bottom
part) for a parallel climate model executing on 64 Intel DELTA
processors. In the space-time diagram, the color of the lines
representing communications indicates the size of the message being
transferred. The climate model is a complex program with multiple
phases. Initially, only processor 0 is active. Subsequently, the
model alternates between computation and communication phases. Some of
the communication phases involve substantial idle time, which should
be the subject of further investigation.
Communication
displays can be used both to obtain more
detailed information on communication volumes and communication
patterns and to study causal relationships, for example between
communication patterns and idle time.
Plate 10
shows some of these displays, applied here to the trace data set of
Plate 8/A>.
The communication matrix on the left and the circle on the right both
show instantaneous communication patterns. The colors in the
communication matrix indicate communication volume, as defined by the
scale above the matrix. Most matrix entries are on the diagonal,
which indicates mostly nearest-neighbor communication. Another display in
the top right presents cumulative data on processor utilization.
Plate 10 is not available in the online version.
A disadvantage of Paragraph is that the relationship between
performance data and program source is not always clear. This problem
can be overcome in part by explicitly logging events that record the
start and end of ``tasks'' corresponding to different phases of a
program's execution. Paragraph provides task Gantt and task histogram
displays to examine this information.
Of the portable tools described here, Paragraph is probably the
simplest to install and use. Because it operates on automatically
generated traces, it can be used with little programmer intervention.
Paragraph displays are particularly intuitive, although the inability
to scroll within display windows can be frustrating.
Upshot is a trace analysis and visualization package developed at
Argonne National Laboratory for message-passing programs. It can be
used to analyze traces from a variety of message-passing systems: in
particular, trace events can be generated automatically by using an
instrumented version of MPI. Alternatively, the programmer can insert
event logging calls manually.
Upshot's display tools are designed for the visualization and analysis
of state data derived from logged events. A state is defined by a
starting and ending event. (For example, an instrumented collective
communication routine can generate two separate events on each
processor to indicate when the processor entered and exited the
routine.) The Upshot Gantt chart display shows the state of each
processor as a function of time. States can be nested, thereby allowing
multiple levels of detail to be captured in a single display. States
can be defined either in an input file or interactively during
visualization. A histogramming facility allows the use of histograms
to summarize information about state duration
(Plate 11).
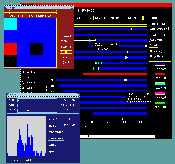
(GIF 24137 bytes; RAS 729587 bytes.)
Plate 11: Gantt chart, state duration histogram, and
instantaneous state diagram for a search problem running on 16
processors, generated using Upshot. Image courtesy of E. Lusk.
Plate 12
illustrates the use of nested states within Upshot. This is a trace
generated from a computational chemistry code that alternates between
Fock matrix construction (Section 2.8) and matrix
diagonalization, with the former taking most of the time. Each Fock
matrix construction operation (blue) involves multiple integral
computations (green). A substantial load imbalance is apparent---some
processors complete their final set of integrals much later than do
others. The display makes it apparent why this load imbalance occurs.
Integrals are being allocated in a demand-driven fashion by a central
scheduler to ensure equitable distribution of work; however, smaller
integrals are being allocated before larger ones. Reversing the
allocation order improves performance.
Plate 12 is not available in the online version.
Upshot provides fewer displays than does Paragraph, but has
some nice features. The ability to scroll and zoom its displays is
particularly useful.
The Pablo system developed at the University of Illinois is the most
ambitious (and complex) of the performance tools described here. It
provides a variety of mechanisms for collecting, transforming, and
visualizing data and is designed to be extensible, so that the
programmer can incorporate new data formats, data collection
mechanisms, data reduction modules, and displays. Predefined and
user-defined data reduction modules and displays can be combined in a
mix-and-match fashion by using a graphical editor. Pablo is as much a
performance tool toolkit as it is a performance tool proper and has
been used to develop performance tools for both message-passing and
data-parallel programs.
A source code instrumentation interface facilitates the insertion of
user-specified instrumentation into programs. In addition, Pablo
calls can be incorporated into communication libraries or compilers to
generate trace files automatically. When logging an event, Pablo can
be requested to invoke a user-defined event handler that may perform
on-the-fly data reduction. For example, a user-defined handler can
compute communication statistics rather than logging every message or
can combine procedure entry and exit events to determine procedure
execution times. This very general mechanism provides great
flexibility. A disadvantage is that the overhead associated with
logging an event is greater than in other, less general systems.
A novel feature of Pablo is its support for automatic
throttling
of event data generation. The user can specify a
threshold data rate for each type of event. If events are generated at
a greater rate, event recording is disabled or replaced by periodic
logging of event counts, thereby enabling a variety of
events to be logged without the danger that one will unexpectedly swamp the system.
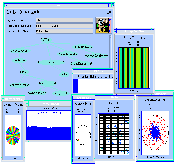
Pablo provides a variety of data reduction and display modules that
can be plugged together to form specialized data analysis and
visualization networks. For example, most displays provided by
Paragraph can be constructed using Pablo modules. This feature is
illustrated in
Plate 13,
which shows a variety of Paragraph-like displays and the Pablo network
used to generate them.
As noted earlier, Pablo uses its own SDDF.

(GIF 67844 bytes; RGB 635350 bytes.)
Plate 13: Pablo display of performance data collected from a
numerical solver. Image courtesy of D.~Reed.
An interesting feature of the Pablo environment is its support for
novel ``display'' technologies, such as sound and immersive virtual
environments. Sound appears to be particularly effective for alerting
the
user to unusual events, while immersive virtual environments can be
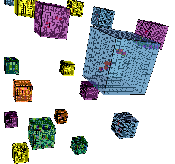
used to display higher-dimensional data, as illustrated in
Plate 14.
In this plate, each cube represents a different performance metric,
and the spheres within the cubes represent processors moving within a
three-dimensional metric space. While both approaches are still
experimental at present, they are suggestive of future directions.

(GIF 184245 bytes; RGB 622138 bytes.)
Plate 14: Pablo virtual
reality display of performance data. Image courtesy of D. Reed.
The Gauge performance tool developed at the California Institute of
Technology is distinguished by its focus on profiles and counters
rather than execution traces. The Gauge display tool allows the user
to examine a multidimensional performance data set in a variety of
ways, collapsing along different dimensions and computing various
higher-order statistics. For example, a three-dimensional view of an
execution profile uses color to indicate execution time per processor
and per routine; corresponding two-dimensional displays provide
histograms for time per routine summed over all processors or for time
per processor for all routines. Idle time is also measured on a
per-processor basis and associated with program components by
determining which task is enabled by arrival of a message. Some of
these displays are illustrated in
Plate 7.
The ParAide system developed by Intel's Supercomputer Systems Division
is specialized for the Paragon parallel computer. It incorporates a
variety of different tools. Modified versions of the standard Unix
prof and gprof tools provide profiling on a per-node
basis. An enhanced version of Paragraph provides various data
reduction and display mechanisms. The System Performance
Visualization system uses displays specialized for the Paragon's
two-dimensional mesh architecture to show data collected by hardware
performance monitors. These provide detailed low-level information
regarding the utilization of the processor, communication network, and
memory bus. This fine level of detail is made possible by hardware
and operating system support in the Paragon computer.
The IBM AIX Parallel Environment is specialized for IBM computers, in
particular the SP multicomputer. It incorporates a variety of
different tools. A variant of the standard Unix prof and
gprof commands can be used to generate and process multiple profile
files, one per task involved in a computation. The Visualization Tool
(VT) can be used to display a variety of different trace data. Three
types of trace data are supported, as follows:
-
A communication record represents a low-level communication event,
such as a send, receive, or call to a global (collective)
communication routine.
-
A system statistics record samples low-level statistics such as CPU
utilization, disk traffic, and virtual memory statistics. The
sampling rate can be selected by the programmer.
-
An application marker record is generated manually by a programmer and
may be used to delineate distinct stages in a program's execution.
Communication trace records and system statistics are generated
automatically, although the programmer can turn them on and off and
can control their frequency.
VT displays are similar to those provided by Paragraph in many respects, but
they give the programmer greater flexibility in how data are displayed
and can deal with a wider range of data.
Plate 15
shows one display, in this case a space-time diagram.
The Automated Instrumentation and Monitoring System (AIMS) developed
at the NASA Ames Research Center provides both instrumentation tools
and a variety of trace visualization mechanisms for message-passing
programs. Users can either specify trace events manually or request
AIMS to log communication events and procedure calls automatically.
The resulting traces can be visualized by using the AIMS View Kernel (VK),
Pablo, or Paragraph. A strength of AIMS is its tight
integration with a source code browser that allows the user both to
mark code blocks for tracing and to relate communication events with
source code. For example, the user can click on a line representing a
communication in a space-time diagram to identify the corresponding
communication operation in the source code. AIMS also provides
statistical analysis functions that can be used to determine average
resource utilization and message latencies.
We conclude this section by noting that while general-purpose tools
have the advantage of being easy to use, custom performance tools can
also be valuable, particularly in
understanding the performance of a complex parallel program.
Extensible tools
such as Pablo can be useful in this regard. So can text manipulation
systems such as awk and PERL, statistical packages such as Mathematica
and Matlab, and general-purpose graphics packages such as AVS.
As an example of this approach,
Plate 5
shows an image generated by a tool developed specifically to help
understand load imbalances in a parallel climate model. This tool
collects timing data by using interval timers and counters inserted
manually into the parallel climate model. The data are postprocessed
to compensate for timer overhead and are then displayed by using a
general-purpose graphics package. Sequences of such images provide
insights into how computational load varies over time, and have
motivated the design of load-balancing algorithms.
![[DBPP]](pictures/asm_color_tiny.gif)


![[Search]](pictures/search_motif.gif)
Next: 9.5 Summary
Up: 9 Performance Tools
Previous: 9.3 Data Transformation and Visualization
© Copyright 1995 by Ian Foster

![[DBPP]](pictures/asm_color_tiny.gif)


![[Search]](pictures/search_motif.gif)
